

                   True Stress-Strain Curve (or) Flow Curve :

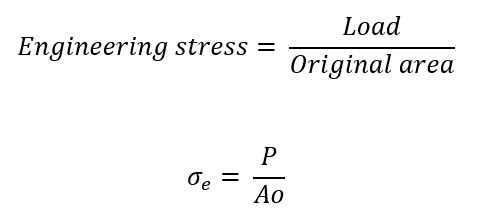
The conventional engineering stress-strain curve for ductile material is based on original cross-sectional area. Thus, it doesn’t explain the deformation characteristics of a metal properly. Whereas the true stress-strain curve is based on instantaneous cross-sectional area of the material. In engineering stress-strain curve we can see that the curve drops after maximum load(necking). This is due to the fact that the stress is based on the original area. This stress is known as engineering stress and is given by :


After necking the load required to deform the material decreases and area being constant the stress also decreases, thus the curve drops until fracture.

But here in true stress-strain curve the stress is based on instantaneous area during the application of load. Thus, during necking we know that the area decreases and in turn the stress increases since the stress and area are inversely proportional. Thus, the curve slopes upwards in a true stress-strain curve. This stress is known as true stress. It is given by :


The trues strain is also known as logarithmic strain or natural strain. It is given by :

True stress at maximum load :

The true stress at maximum load corresponds to the true tensile strength(i.e. UTS in the case of engineering stress-strain curve). The necking begins from the maximum load for most of the material. The true stress at maximum load is given by :

Here, the strain is given in terms of area. This is due to the fact that the strain after the onset of necking(i.e. beyond maximum load) must be expressed in terms of area or diameter only.

Equating both of them,


True fracture stress and strain:

The true fracture stress is the load at fracture divided by the cross-sectional area at fracture. And the true fracture strain is the strain based on the original cross-sectional area and the area after fracture.


Power law :

The flow curve of many metals in the plastic deformation region can be expressed by a relation known as power law. It is given by :

Where, K is the strength coefficient, n is the strain-hardening coefficient.

Significance of power law :

·       The n value determines the shape of the true stress-strain curve. As n value varies the shape of the curve also varies.

·       In n is low the initial work hardening rate is high and decreases rapidly with strain and vice versa.

·       n=0 for perfectly plastic solid, n=1 for elastic solid and n=1.5 for 0.1<n<0.5 for most of the metals.


Comments

Popular posts from this blog

THE IRON-CARBON PHASE DIAGRAM Of all binary alloy systems the one that is possibly the most important for a metallurgist is the iron and carbon system. We know that both steel and cast iron play a important role in structural applications and they both are iron-carbon system. Pure iron upon heating experiences changes in its crystal structure until 1538 °C and melts there. At room temperature it is present at a stable form called ferrite(α), which has a BCC crystal structure. The ferrite transforms to austenite( ט ) at 912°C which has a FCC crystal structure. At 1394°C it again undergoes a phase transformation to                                δ-ferrite which has a BCC crystal structure. Pure iron finally melts at 1538°C. All these changes can be seen in the left vertical axis of the Fe-C phase diagram. In the composition axis ...
  Glass Fiber   Introduction   Glass fiber was invented by Russell Games Slayter in thermal building insulation. There are many different compositions available but usually glass fibers are silica based (~50-60%) and a host of oxide(iron,aluminium,etc.) is also present in the fiber. It is cheap compared to other fibers and can be achieved in a variety of forms.   Production   Glass fiber is made by requiring raw materials melting in a hopper and transferring into molten glass. Raw materials are added into the hopper through batch mixing. After that some addition of other oxides are done and then the mixture is melted in the furnace.   After achieving molten glass, it is passed through the electrically heated platinum bushings or crucibles to achieve fibers of required diameters. Usually there are 200 holes in the crucibles. Outcome after molten glass is passed through crucibles is wounded on a drum. The schematic of this production is sh...
                                                                 Engineering Stress-Strain Curve The engineering stress-strain curve gives the relationship between stress and strain for a ductile material. It is generally obtained by applying load to a tensile specimen. The curve reveal many properties of a material such as Young's Modulus(E), Yield point, UTS   etc. Stress : The stress in the engineering stress-strain diagram is given by load divided by the original area. Strain : The strain in the engineering stress-strain curve is giver by ratio of change in length / elongation to its initial length. Strain has no unit since it’s a ratio of two quantities. Proportionality limit : I...